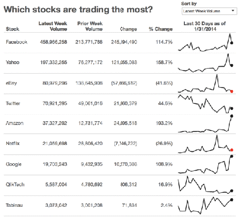
Today, I’m writing about combining KPIs and sparklines in a single view. It’s very common for business users to want to see KPIs and trends in the same view. These give them a sense for the overall direction of their product and also highlight the most meaningful numbers to them. I often see people create these as separate worksheets in Tableau, but with this post, I’m going to show you how to combine them into a single view.Combining them into a single view provides a couple of benefits:Tableau only needs to render a single sheet, so until parallel processing comes out in v9, you’ll see a performance benefit.If you have a hierarchy, then expanding the hierarchy will keep the table and the sparklines together.
KPIs and Sparklines in the same Worksheet By Andy Kriebel
Want to Get Latest Updates and Tips on Tableau Bites Blogs
Sign Up For Newsletter


