LOOM ART IN TABLEAU

Want to Get Latest Updates and Tips on Tableau Bites Blogs

535df6c8 ed8d 4b68 bebd d15d95be65be.png

Just because you can. Ken Flerlage uses Bézier curves to create visualisations based on images. Although you’re unlikely to use this extreme example, its good to see how this can be done.
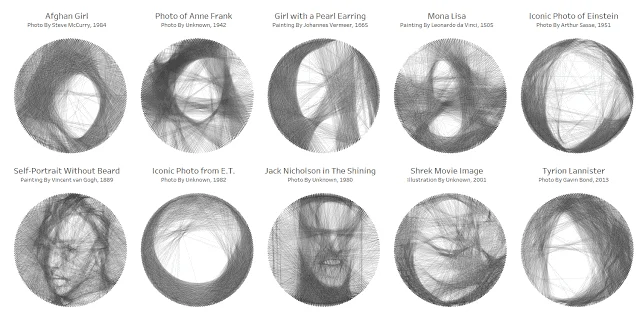
Read Original Article…

Share This Post:

001 database

Tableau Training on
Tap Fast Track

data scientist 1

Tableau Advanced Analyst

002 bar chart

Tableau
Foundation

003 network

Tableau Training
on Tap

Share :

Leave a Comment

Your email address will not be published. Required fields are marked *