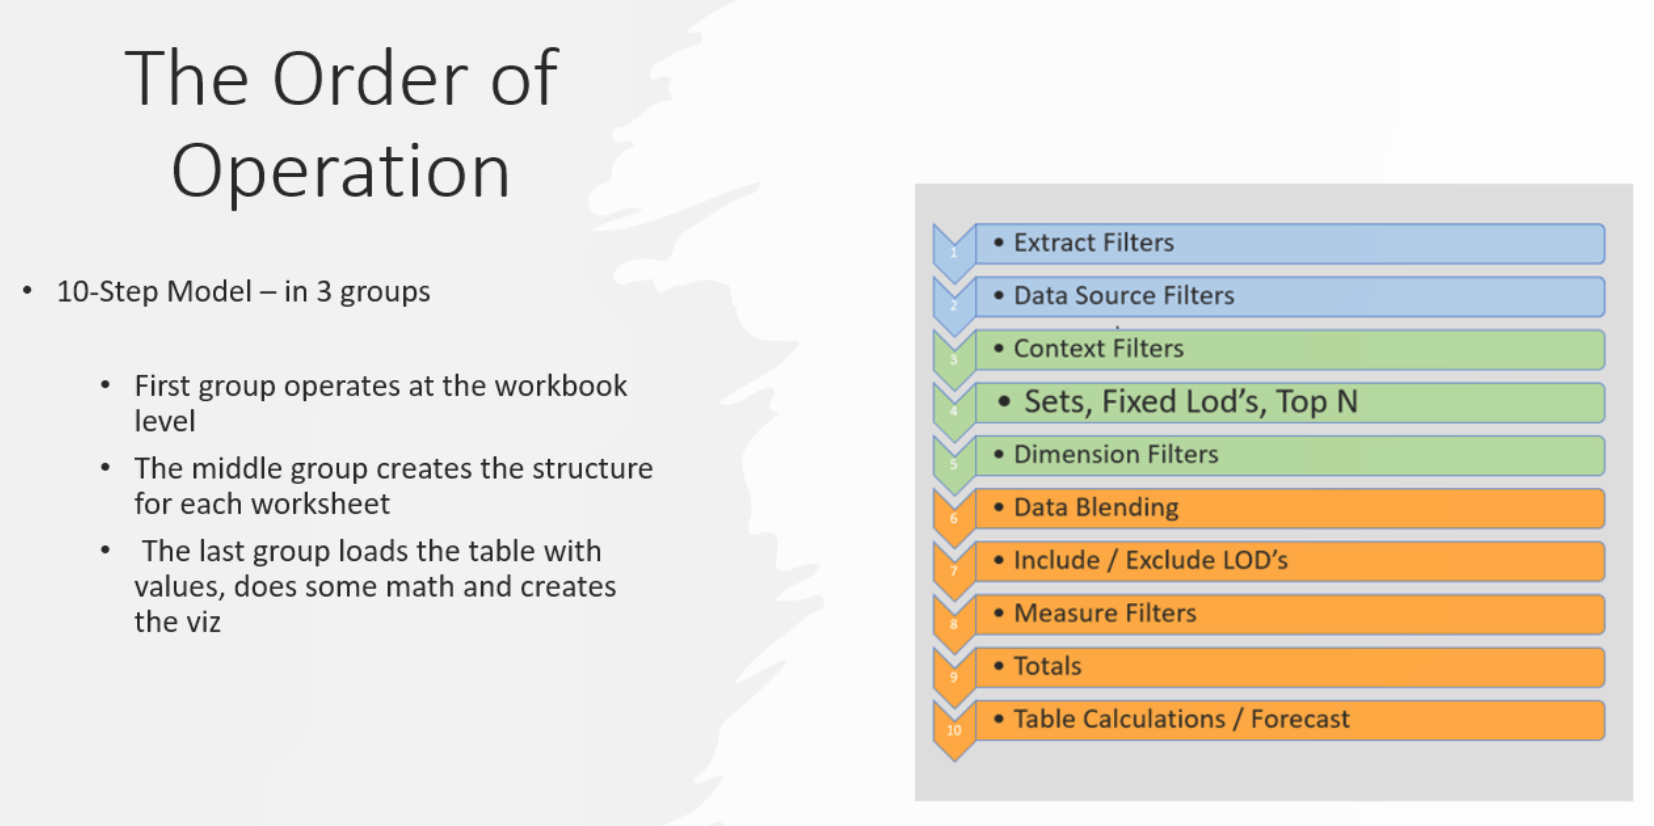
Jim Dehner talks us through, shedding light on the sequential process that dictates how a new worksheet is created. Divided into 10 steps, he explains each stage in detail, starting with the workbook-level operations and progressing to the creation of data tables, calculations, and visualisations. By exploring the specific impact of each step on simple and complex calculations, we can develop a deeper understanding of how Tableau processes data and generates visualisations.
One of the key aspects covered in the post is the use of filters in Tableau. It discusses various filter types, including source and extract filters, context filters, and dimension filters, and how they contribute to the overall Order of Operation. This post explores the powerful concepts of Level of Detail (LOD) expressions and table calculations, providing examples and explanations on how to leverage them effectively in Tableau – equipping readers with the knowledge and techniques to unlock the full potential of calculations in their visualisations.


