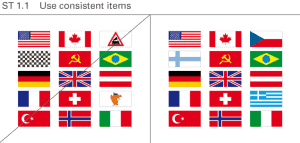
Items in a group should be of the same type, i.e. homogeneous. Homogeneous items can be different types of cars, houses, traffic signs, or – as shown in the figure SUCCESS rule ST 1.1, on the right hand side – different national flags representing the corresponding nations. The left hand side of this figure includes other types of items besides national flags, destroying the homogeneity.
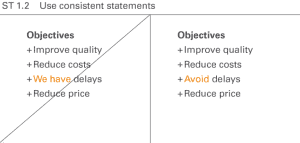
A list of statements will be easier to understand if the statements follow a homogeneous structure. The right hand side of figure SUCCESS rule ST 1.2 shows four suggestions. By contrast, on the left-hand side of this figure the third statement is a detection, not a suggestion.
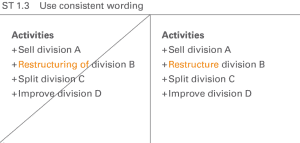
Structure all phrases – especially in listed arrangements – in a homogeneous manner to facilitate quicker understanding. The right hand side of figure SUCCESS rule ST 1.3 shows a group of four homogeneous suggestions, an imperative verb paired with a noun. By contrast, on the left hand side of this figure the second suggestion uses verbal substantive instead of an imperative.
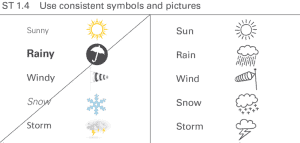
Symbols and pictures that are uniform in respect to their layouts, colors, forms, fonts, etc. – especially in listed arrangements – facilitate faster and easier comprehension.
Structure reports and presentations in such a way that the parts, chapters, sections, and paragraphs do not overlap. They should not cover the same aspects.
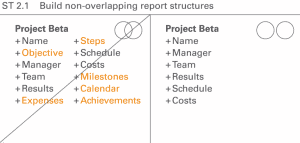
In figure SUCCESS rule ST 2.1, on the left hand side, the following chapters of a project description overlap:
- expenses and costs
- schedule, steps, milestones, and calendar
- objective, results, and achievements
At first glance, the six terms on the right hand side of this figure have no overlap in their logical structure. Of course, a relationship exists between the cost, the results, and the schedule of a project, but in regards to the content of the chapters this is not an overlap.
Structure a group of business measures in lists or calculations in a way they do not overlap, i.e. business measures on one hierarchical level should be disjoint or mutually exclusive.
Looking at figure SUCCESS rule ST 2.2, the following business measures on the left hand side are overlapping:
- material costs and costs of goods sold
- depreciation and fixed costs
The calculation scheme on the right hand side has been cleaned up.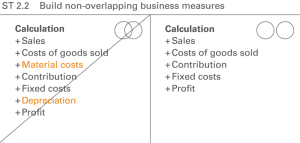
The elements of the structure dimensions used in reports and presentations should not overlap, i.e. the elements of a structure dimension should be disjoint or mutually exclusive.
Looking at figure SUCCESS rule ST 2.3 on the left hand side, the regions Norway, Sweden, Denmark and Finland overlap with Scandinavia.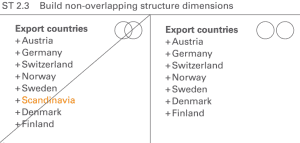
If some important arguments relating to a specific question are left out, the given answer will not be convincing.
Looking at figure SUCCESS rule ST 3.1 on the left hand side, the option “old products, new location” is missing.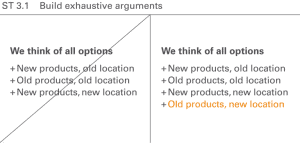
The elements of structures presented in charts and tables should also be exhaustive, in other words, adding up to one hundred percent.
In many practical applications of this kind, adding a “rest” element helps to conform to this rule.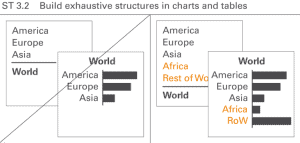
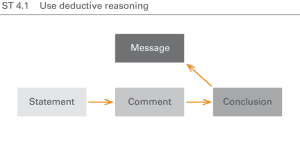
Exhibiting deductive reasoning (logical flow) for a given message aids in building hierarchical structures. Logical flows begin with a statement (all men are mortal), continue with a comment (Socrates is a man), and resolve with a conclusion (Socrates is mortal) culminating in the message (Socrates will die). It forces the readers or the audience to reproduce the deduction. It can be best applied in controversial discussions.
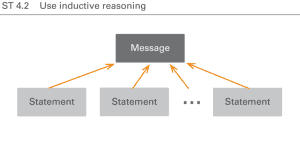
Exhibiting inductive reasoning (logical groups) for a given message aids in understanding hierarchical structures. Logical groups are homogenous, non-overlapping, and collectively exhaustive arguments culminating in a message. This results in a powerful argumentation that satisfies the addressees need for an easily comprehensible logical structure.
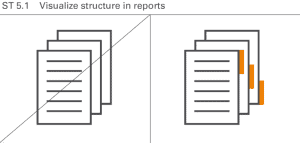
For easier understanding, underscore the logical structure of reports and presentations with visual aids (e.g. outlines, dashboards, and summaries). Figure SUCCESS rule ST 5.1 illustrates this rule showing binder tabs on the right hand side.
Design tables in such a manner that their hierarchical structure can be recognized in both the columns as well as the rows.
The right hand side of figure SUCCESS rule ST 5.2 shows three hierarchical levels of rows in a table. The base level shows cities, the first summary shows regions, and the second summary shows the country.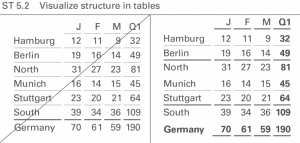
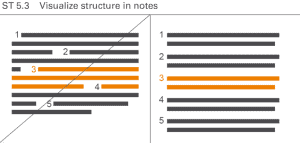
Notes are also easier to understand when their structure is shown clearly (see figure SUCCESS rule ST 5.3).