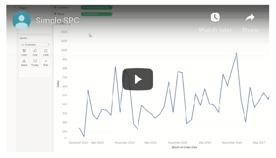
One of the major subsets of analysis (or drivers for analysis) is “Is this normal behaviour?”, and one of the most common chart types to address this question is the Control Chart. In short it plots a measure over time and compares this to an upper and lower “Control Limit” giving you confidence that a process or outcome is normal and/or under control.
Process Control Charts By Chris Dickson
Want to Get Latest Updates and Tips on Tableau Bites Blogs
Sign Up For Newsletter


