This post is a great starting point to explore the endless possibilities of chart customisation. Dawn Harrington provides links to Tableau Public dashboards where you can see these techniques in action. Whether you want to create rounded bar charts, progress bars, or jittered bar charts, there’s something for everyone. And if you’re working with line charts, the post also delves into maximising data-to-ink ratio, using marker effects, and combining area and line charts with a dual axis.
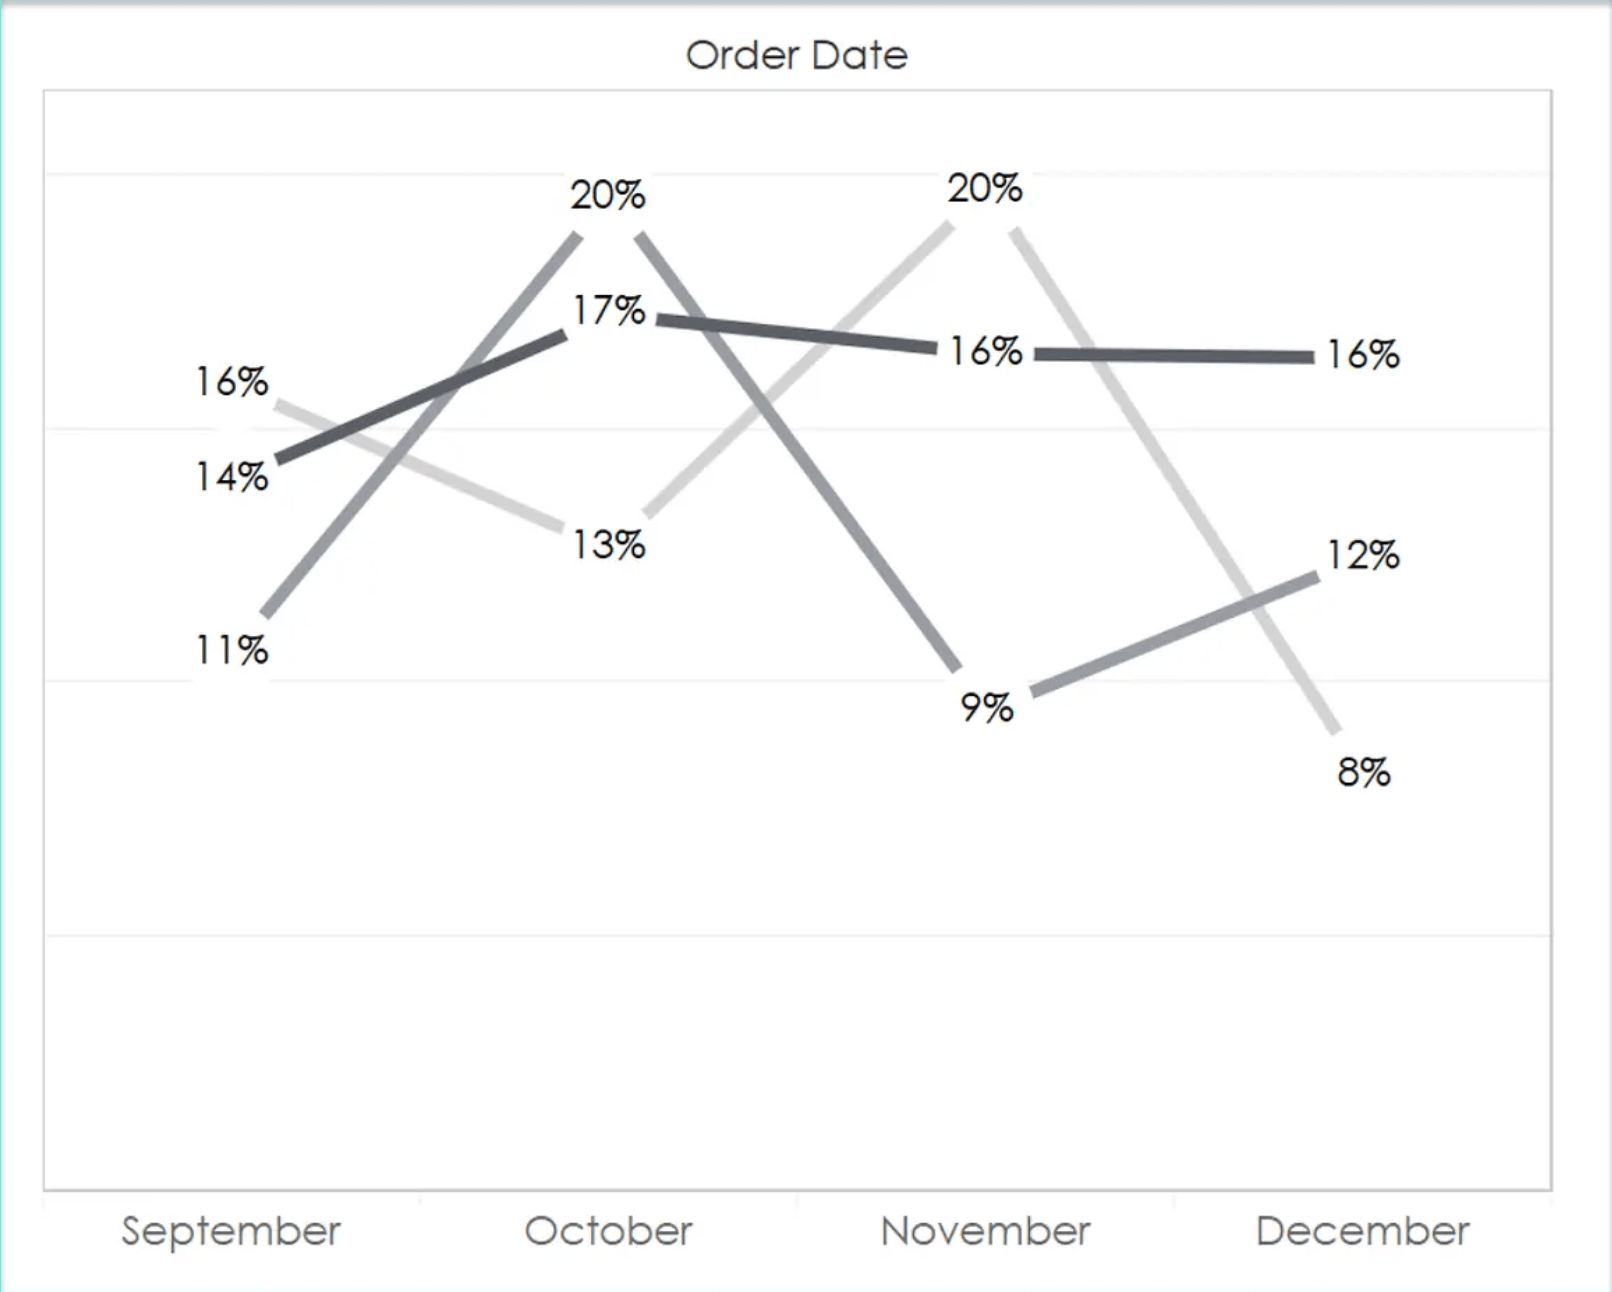

Tableau Training on
Tap Fast Track

Tableau Advanced Analyst

Tableau
Foundation

