Mark Edwards talks through various incarnations of a design for a tadpole chart. This can be a great way to visualize period-over-period changes for multiple members in a dimension
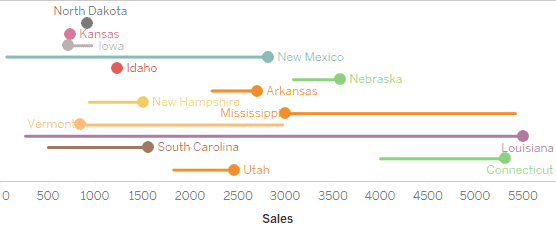

Tableau Training on
Tap Fast Track

Tableau Advanced Analyst

Tableau
Foundation

