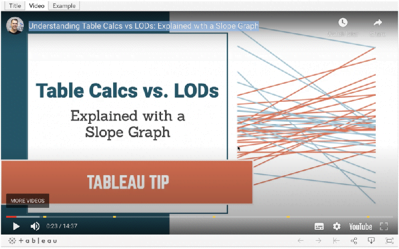
Here, Andy Kriebel tells us, “Table calculations and LODs, especially understanding the difference between when to use each, is one of the most difficult concepts to learn in Tableau.
Through my time teaching, one of the most effective means for explaining the differences between them is with a simple slope graph…”
Understanding table calcs vs LODS: explained with a slope graph
Want to Get Latest Updates and Tips on Tableau Bites Blogs
Sign Up For Newsletter


