Klaus Schulte explains how you can visualise one of the most important documents for an accountant, a profit and loss statement. The Zen Master mentions using the scorecard approach to creating a P&L statement in Tableau while using different approaches to bring context for your statements.
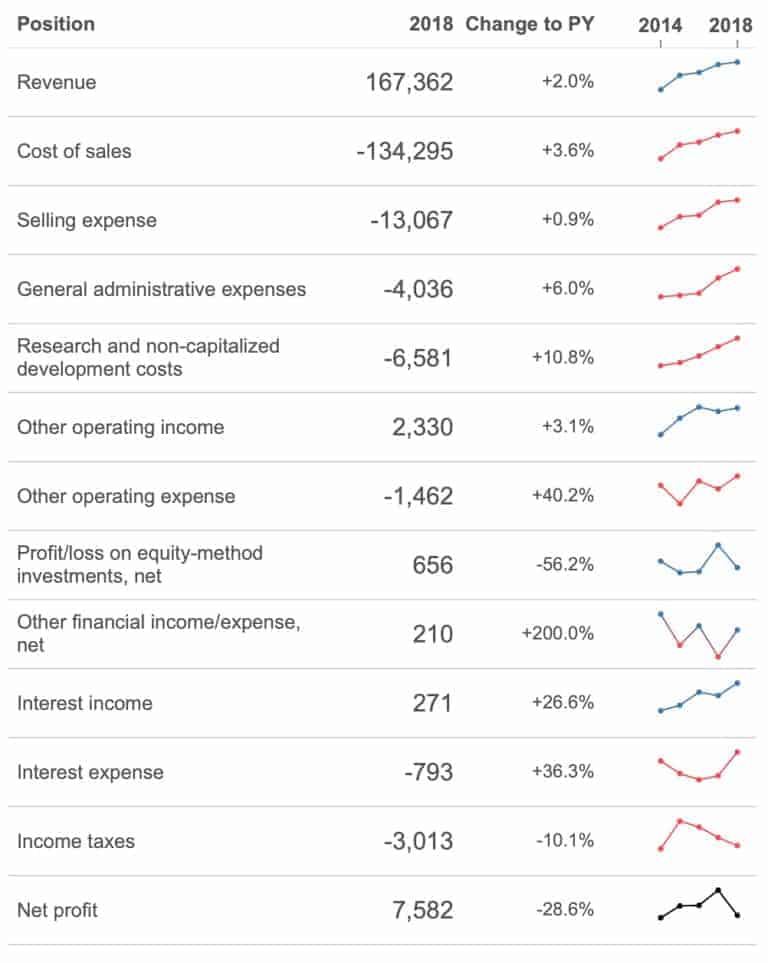

Tableau Training on
Tap Fast Track

Tableau Advanced Analyst

Tableau
Foundation

