Colin Wojtowycz visually analyses the questions to ‘why’, by using Tableau’s new dedicated dashboard buttons. Colin explains how having different views enables the audience to see different insights from the same data, which enables them to be able to ask and answer business questions quickly.
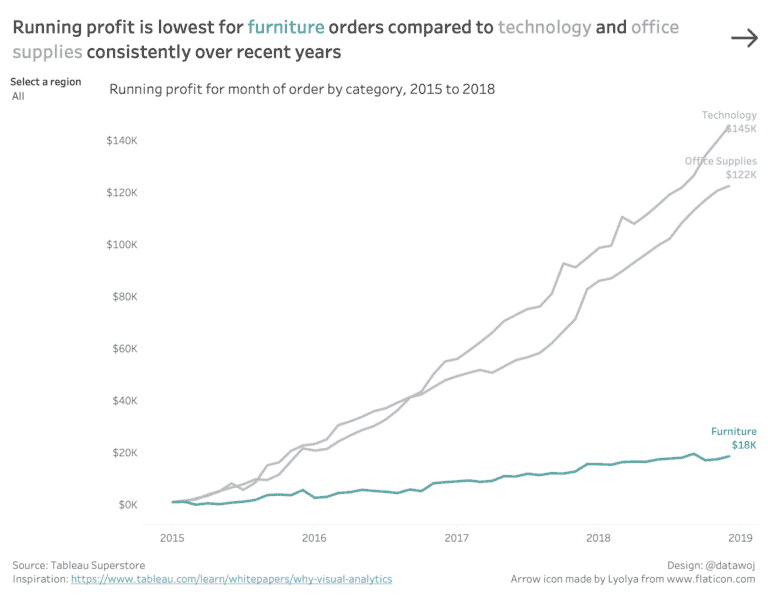

Tableau Training on
Tap Fast Track

Tableau Advanced Analyst

Tableau
Foundation

