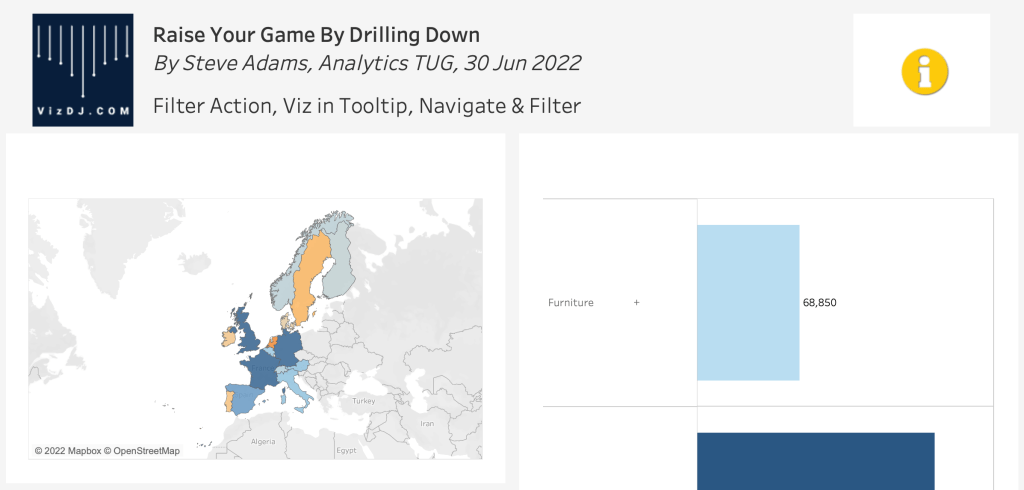
Raise Your Game By Drilling Down in Tableau
The Tableau Analytics TUG – 30 June, 2022 I was honoured to be asked to present at the above event…which gave me the opportunity to present one of my favourite…
The Tableau Analytics TUG – 30 June, 2022 I was honoured to be asked to present at the above event…which gave me the opportunity to present one of my favourite…

Moving from “Rubbish” to “Being confident” can drive a mindset change. It’s crucial to invest in the people on your team. When they first started with us, several of the
How you can move from “Rubbish” to “Being confident” with Tableau Read More »
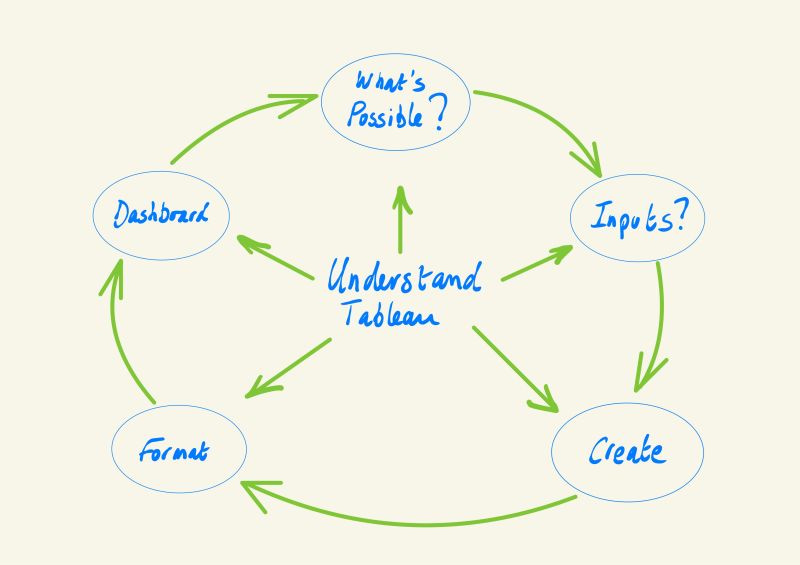
It’s easy to lose sight of the “why” when beginning a team’s transitional learning journey. Why am I going through this? What’s the point? Why is this tough learning process
The Power of “WHY”, When Migrating Your Teams to Tableau. Read More »
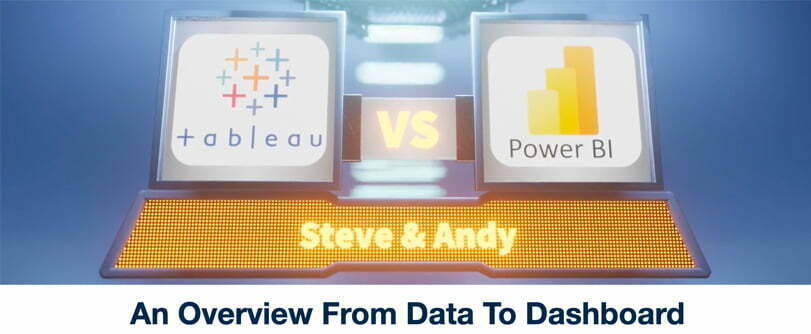
How Is Tableau Different From Power BI? Thats the question we asked ourselves, and we quickly realised there are very few people actually comparing the two leading Data Visualisation tools at the functional
Tableau VS Power BI – How To Go From Data to Dashboard Read More »
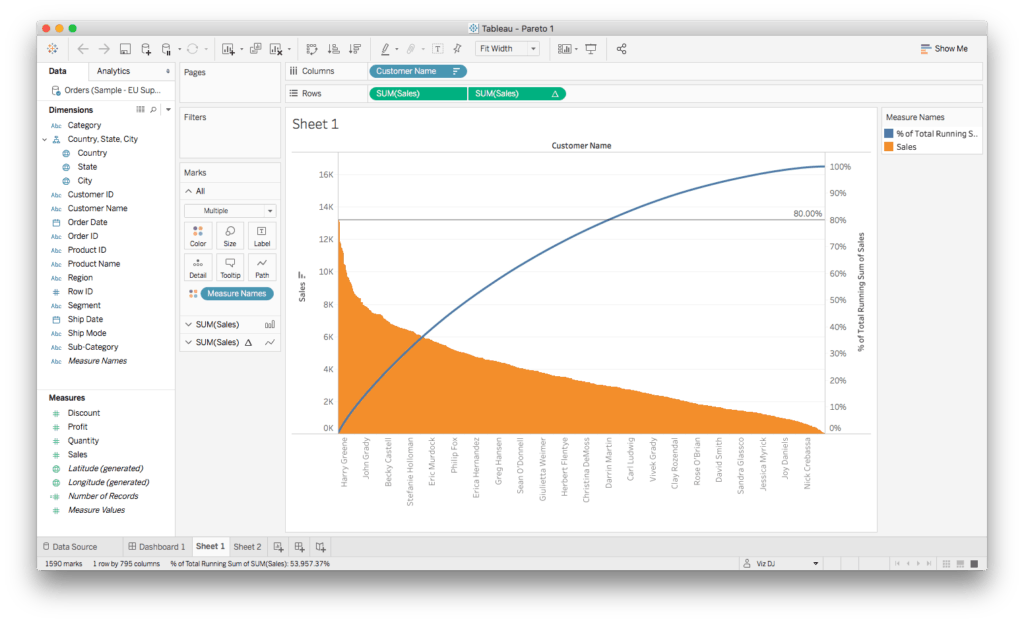
Pareto Chart (the “80/20” viz): – a type of chart that contains both bars and a line graph, where individual values are represented in descending order by bars, and the
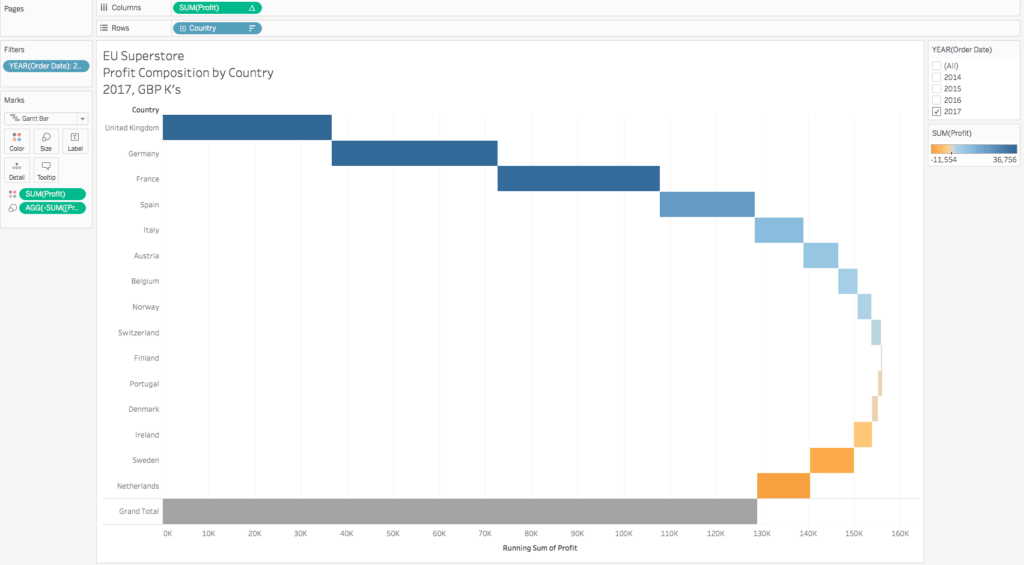
What is a waterfall chart good for? What is a waterfall chart good at? Discuss composition of negative / positive elements – e.g. profit, variance. Maybe discuss time on
