One of the things that makes Tableau different than other tools is its interactivity…Eric Parker demonstates with a dashboard he’s set up how you can select one of the
circles in the “Sales by Quarter” worksheet and it will update the entire dashboard.
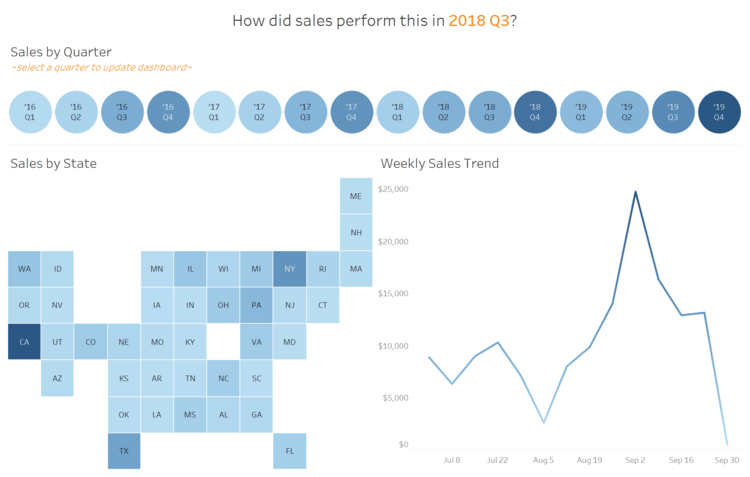

Tableau Training on
Tap Fast Track

Tableau Advanced Analyst

Tableau
Foundation

