Square Sankey P&Ls in Tableau

Want to Get Latest Updates and Tips on Tableau Bites Blogs

Interpreting the chart

Squared Sankey P&Ls in Tableau is a joint work of Liam Spencer & Klaus Schulte. It shows a P&L flowing from the revenues at the top to the net profit at the bottom of
the chart and was inspired by a chart originally created by Nadieh Bremer.
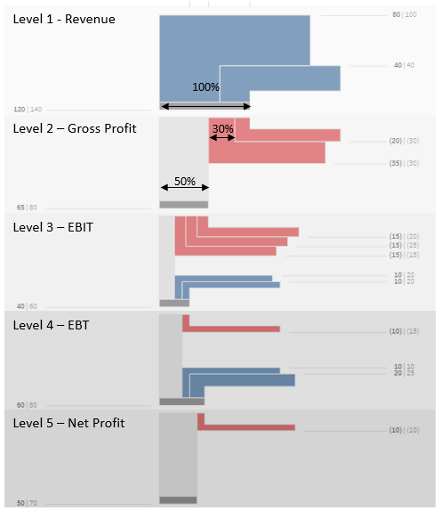
Read Original Article…

Share This Post:

001 database

Tableau Training on
Tap Fast Track

data scientist 1

Tableau Advanced Analyst

002 bar chart

Tableau
Foundation

003 network

Tableau Training
on Tap

Share :

Leave a Comment

Your email address will not be published. Required fields are marked *