The Tableau Magic continues to spread from Toan Hoang as he shows you how to create a volume dial chart in Tableau. Volume dial charts are great for showing which regions have generated the most percent of sales or healthcare providers are reaching their goals over a set period of time.
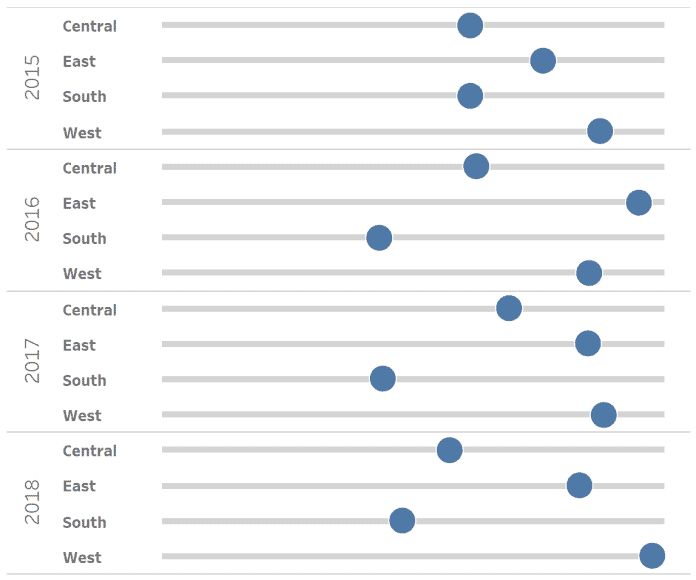

Tableau Training on
Tap Fast Track

Tableau Advanced Analyst

Tableau
Foundation

