Adolfo Hernandez demonstrates how to create unit bar charts that don’t look like bar charts. Adolfo uses Parameters and calculations to create a unit bar chart which shows which US states are progressing in terms of hitting the $500,000 sales goal.
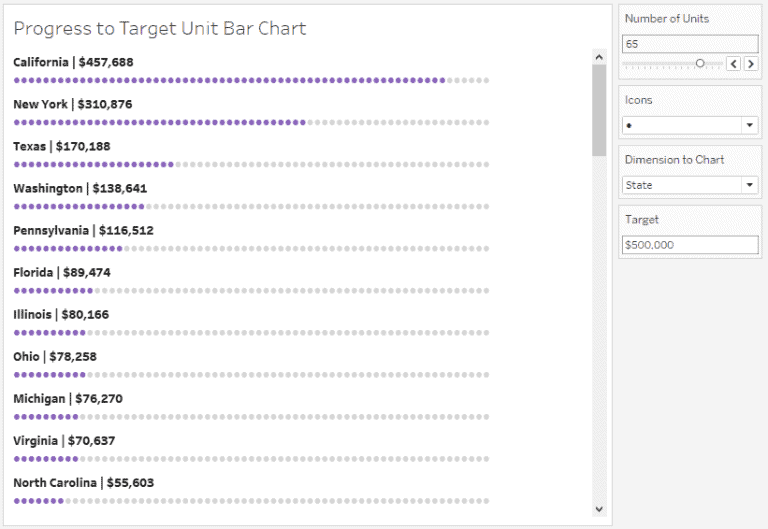

Tableau Training on
Tap Fast Track

Tableau Advanced Analyst

Tableau
Foundation

