There are many Tableau blogs out there on the internet, and it can be tough to know which ones to read. To help make your life a little bit easier, we’ve put together a list of our 10 favourite Tableau blogs. Whether you’re just starting out with Tableau or you’re a seasoned pro, these blogs will teach you something new and help you become even better at using Tableau.
This blog is a signpost to some of the most useful blogs we refer to all the time in our coaching and training sessions. We have selected 10 topics that are essential if you want to master Tableau. They are in no particular order.
Narrowing it down to just one for each topic in some cases was impossible…so apologies to the authors of the other great posts out there…
…if you’d like to add references to others that you believe deserve to be in the company of these here please feel free to add them in the comments below…
Warning!
There is a lot to consume here. Bookmark this page and use it as a reference. Have a quick read to find the ones that are likely to add the most to your Tableau toolbox right now and plan in some time to your diary to run through them.
So without further ado, here they are!
#1: 8 Analytic concepts to express with Tableau Set Actions
Number 1 belongs to Bethany Lyons. No longer at Tableau but much of her content is timeless.

This blog was written soon after the introduction of Set Actions, still one of our all-time favourite features, they created a storm of excitement and content when they came onto the Tableau scene back in 2018.
Bethany walks you through the whats and the why’s of 8 analytical use cases that you should try to apply to your own business data.
Read, watch the videos, download, apply on your own data and enjoy.
#2: How to Dynamically Display the Top N vs Other in Tableau
This is one of the first blog posts I stumbled across by Ryan Sleeper….way back… and it’s just one of those that sits neatly, very near the top of your Tableau Toolbox.

The post itself helped me fall in love with Tableau, Ryans style and the Tableau community in general. This timeless post will help you overcome an often required analytical view of your data.
𝐅𝐨𝐫 𝐜𝐨𝐧𝐭𝐞𝐱𝐭
Top N is great and easy and out of the box.
𝐁𝐔𝐓
Top N & Other means that you see the complete data set which provides context of how significant the Top N is.
It’s not “out of the box” but is still pretty quick and easy to do, once you know how.
It helps us adhere to the Structure Rule of the SUCCESS formula of the IBCS (The International Business Communication Standards) that requires chart structures to be homogeneous, mutually exclusive and collectively exhaustive.
In some cases the Top N may be highly insignificant and so the “Other” dwarfs the view….in which case you need to question whether “The Top N” is giving you want you need… ie… are you asking the right question, or is there a better way to get to the “root cause”…
#3: Single Member Drill Down with Tableau Set Actions
I cannot stress enough how important it is that you will need to answer a number of questions before you get to the root cause of a question, issue or opportunity.
So, as a Tableau dashboard creator, you need to have as many “tools in your box” as you can to easily drive your users to be able to take action, by being able to drill down multiple levels. Data driven.
Often we only want to drill into one item, so that we can focus on what it is comprised of. This is not readily available in Tableau (as at 2022.2) but with the swift use of set actions, we can do it very easily.
There are no simple blogs that I have found that walk through this requirement in as simple a way as Andy Kriebel‘s video blog “How to Add a +/- Indicator to a Drill Down Action”.

It’s only 5 minutes long. And it also shows you how to add an indicator to help guide your user on the action they can take – a nice and easy addition.
Plan in some time watch this video to work out how to easily and quickly drill down into one single member of your dimension, so that you and your users can focus on what matters. Recreate it yourself on Superstore first, and then do it again on your own data.
Enjoy! And a massive thanks to Andy – the OG of Tableau video How-To’s – for all the great content you make freely available.
#4: Statistical Process Control Charts in Tableau
If you have ever wanted to:
- Build a Statistical Process Control Chart in Tableau from scratch, and
- Cheat by using someone else’s hard work to create all the calculations
…then look no further than Ann Jackson’s easy to follow video blog!
From her post:
“𝑾𝒉𝒚 𝑺𝒕𝒂𝒕𝒊𝒔𝒕𝒊𝒄𝒂𝒍 𝑷𝒓𝒐𝒄𝒆𝒔𝒔 𝑪𝒐𝒏𝒕𝒓𝒐𝒍? 𝑾𝒆𝒍𝒍 𝒊𝒕’𝒔 𝒂 𝒈𝒓𝒆𝒂𝒕 𝒘𝒂𝒚 𝒕𝒐 𝒖𝒔𝒆 𝒕𝒉𝒆 𝒅𝒂𝒕𝒂 𝒚𝒐𝒖 𝒉𝒂𝒗𝒆 𝒂𝒏𝒅 𝒂𝒑𝒑𝒍𝒚 𝒅𝒊𝒇𝒇𝒆𝒓𝒆𝒏𝒕 𝒕𝒆𝒔𝒕𝒔 𝒕𝒐 𝒔𝒕𝒂𝒓𝒕 𝒆𝒂𝒓𝒍𝒚 𝒅𝒆𝒕𝒆𝒄𝒕𝒊𝒐𝒏. 𝑺𝒆𝒗𝒆𝒓𝒂𝒍 𝒐𝒇 𝒕𝒉𝒆 𝒓𝒖𝒍𝒆𝒔 𝒐𝒖𝒕 𝒕𝒉𝒆𝒓𝒆 𝒂𝒓𝒆 𝒂𝒊𝒎𝒆𝒅 𝒂𝒕 𝒇𝒊𝒏𝒅𝒊𝒏𝒈 “𝒐𝒖𝒕-𝒐𝒇-𝒄𝒐𝒏𝒕𝒓𝒐𝒍,” 𝒏𝒐𝒏-𝒏𝒐𝒓𝒎𝒂𝒍, 𝒐𝒓 𝒓𝒆𝒑𝒆𝒕𝒊𝒕𝒊𝒗𝒆 𝒑𝒂𝒓𝒕𝒔 𝒘𝒊𝒕𝒉𝒊𝒏 𝒂 𝒔𝒕𝒓𝒆𝒂𝒎 𝒐𝒇 𝒅𝒂𝒕𝒂.”

Her video tutorial goes through the first 3 Western Electric rules.
Don’t be fooled by the age of the blog. You will get everything you need to be able to do this yourself as well as a link to her Tableau Public workbook to see how it works.
I followed through her steps and applied them to the Superstore dataset some time ago, and you can download this from my profile if you’d like – with a few small adaptions (I added the ability to drill down through a couple of dimensions, and a parameter to select which measure to chart).
Here’s a link to download my Superstore version.
#5: The Tableau Order of Operations
This is a critical topic to understand in Tableau. It helps you understand why you get sometimes unexpected results, but it also gives you a whole bunch of ways to play with Tableau to get the results you want and need.

And, once you “get” something, doesn’t it just become so much more fun?
For this topic I have cheated. I am suggesting you read 2 brilliant posts on this topic:
- Jim Dehners Order of Operations – Read the post here.
- Ken Flerlage’s The Tableau Order of Operations – Read the post here.
They are both great, and reading both will give you a deeper, rounded understanding.
Now. Don’t let this go to waste. Also book in several 15 minute chunks into your week to apply some of this to your own data.
Play with them. And enjoy.
#6: Ultimate Guide to Tables in Tableau
You often hear from Data Visualization experts that we shouldn’t be using tables. And if you are going to use tables, then add some insights by using highlight table.
But sometimes, in the real world, the end users use case requires a table.
All your wonderful dashboard visualisations, filters and actions have driven us to a limited number of records that still need to be displayed at a record level in order for the user to take action.
And in my eyes Luke Stanke has made himself the 𝐆.𝐎.𝐀.𝐓.𝐓. – 𝐭𝐡𝐞 𝐆𝐫𝐞𝐚𝐭𝐞𝐬𝐭 𝐎𝐟 𝐀𝐥𝐥 𝐟𝐨𝐫 𝐓𝐚𝐛𝐥𝐞𝐚𝐮 𝐓𝐚𝐛𝐥𝐞𝐬- with this wonderful series of blog posts enabling you to improve the native look and feel, usability and functionality of tables on Tableau.

⒈ Ultimate Guide to Tables in Tableau: Introduction.
⒉ Ultimate Guide to Tables in Tableau: Pagination.
⒊Ultimate Guide to Tables in Tableau: Row Density.
⒋ Ultimate Guide to Tables in Tableau: Filtering with Tables.
⒌ Ultimate Guide to Tables in Tableau: Headers.
BONUS: 26 Ways to Enhance Tables in Tableau – Read the bonus blog here.
There’s a huge amount to digest in these blogs so, as ever, I highly recommend you pencil in some learning time into your diary to go through each of them and then apply to your own data so you’re learning sinks in just a little bit deeper.
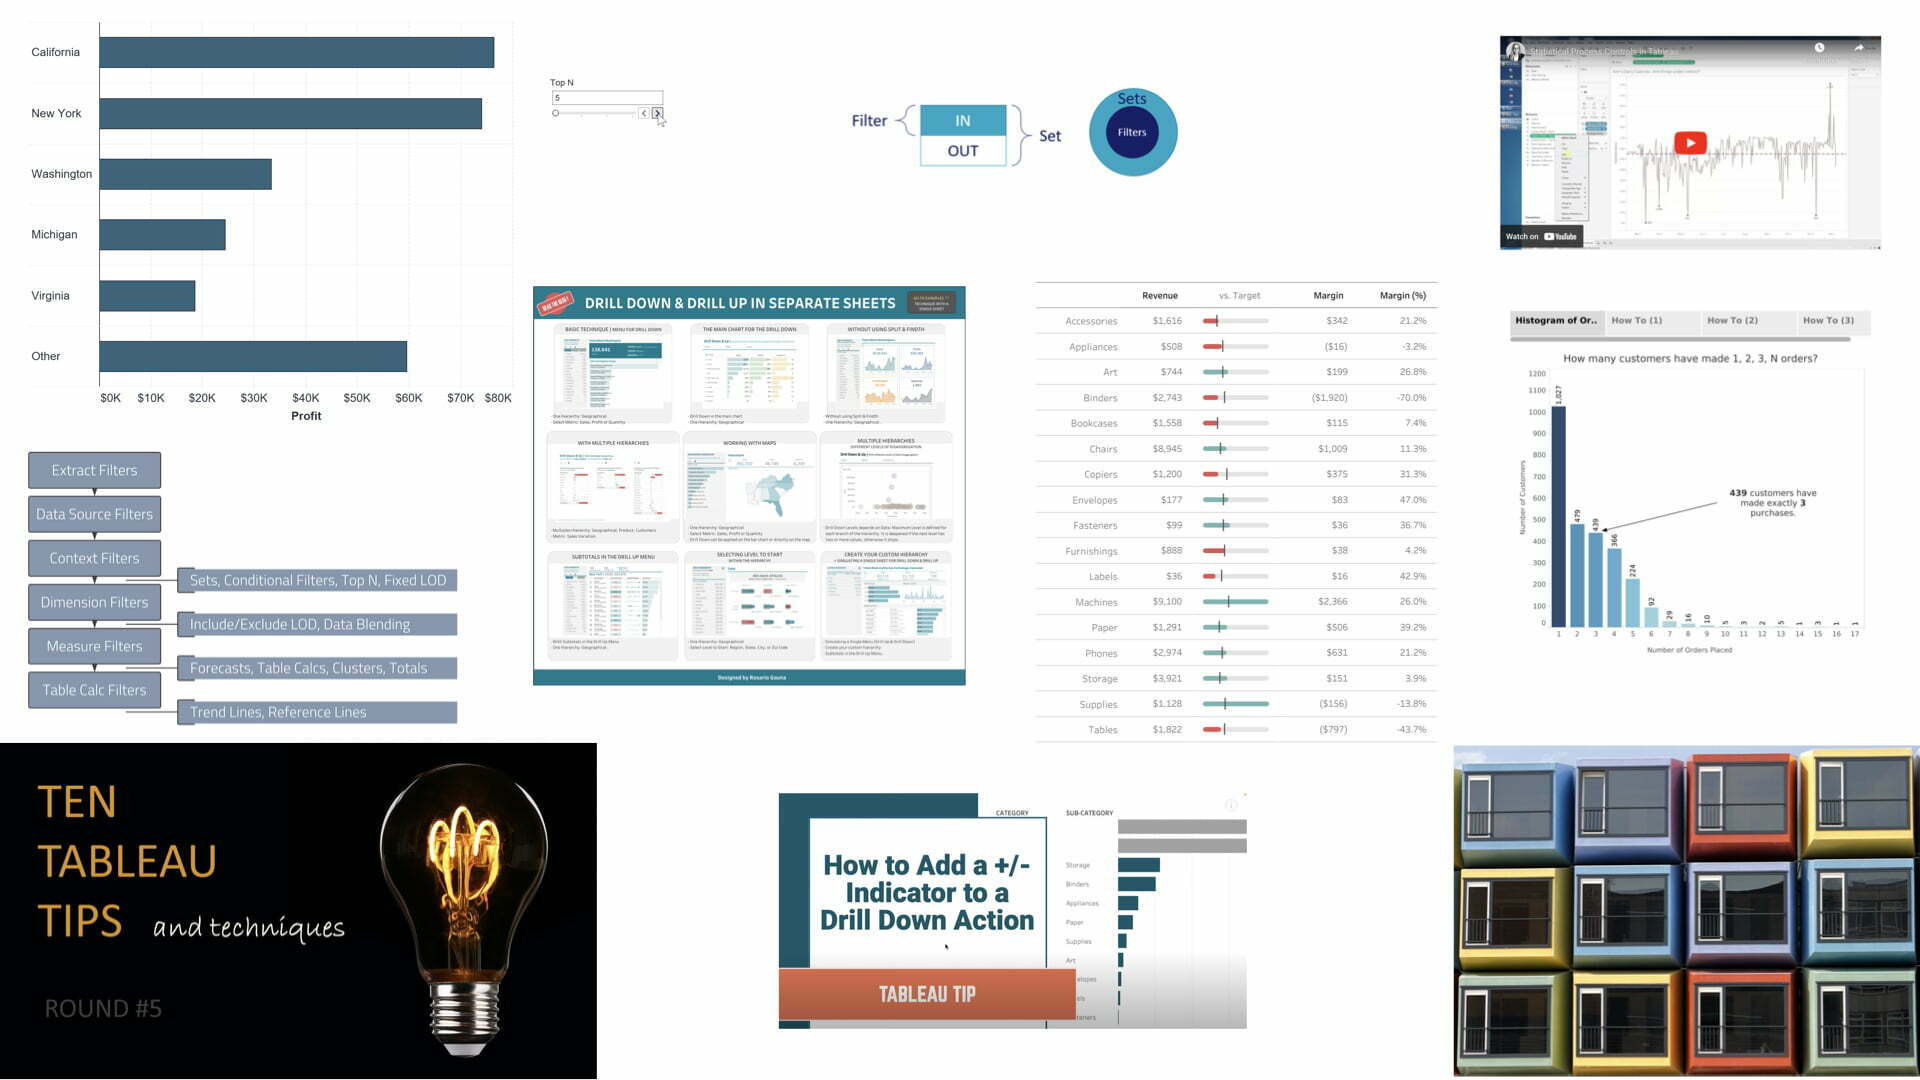
#7: Drilling Down and Drilling Up in Tableau
If you’re not drilling down or drilling up in Tableau then you’re not really Tableau’ing, are you?
There are some fantastic blogs out there about all the different techniques that you can do for performing this.

I’ve selected a group of blogs by people who have collaborated and also written individual blocks on this very subject to give you massive inspiration and choices for the things you can do.
Without further ado I strongly recommend having a read through the following:
- Drill-Down & Up P&Ls in Tableau – By Robert Crocker, Rosario Gauna, and Klaus Schulte: Read here.
- Drill Down with left menu and Drill Up with top menu – By Rosario Gauna: Read here.
- Drill Down & Drill Up in Separate Sheets – By Rosario Gauna – Read here.
- Multiple Drill-Downs in Tableau – By Rosario Gauna, and Klaus Schulte: Read here.
Don’t forget to schedule in time to read these wonderful blogs as well as plan in some more time to apply 1 or 2 of them to your own work and data.
#8: 5 Rounds of Ten Tableau Tips!
Not to be beaten by his twin brother, Kevin Flerlage also makes it to this list by bringing together no less than 5 rounds of his Ten Tableau Tips, which are a combination of tips he has sourced and added his own flavour to, as well as his own-sourced productivity tips and tricks.

Here are the links to those posts:
- Tiny Tableau Tips including the “G button” – Round 1.
- Tiny Tableau Tips including “Browse Periods as a date filter” – Round 2.
- Ten Tips including “Show the Axis on the Top but Not the Bottom” – Round 3.
- Ten Tableau Tips & Techniques including “Create a Stacked Bar in the Grand Total” – Round 4.
- Ten Tips & Techniques including “Add Multiple Pills to the Colour Card” – Round 5.
…I am wondering whether there will one day be a #10 of these one day…
Go through these posts in Tableau yourself – so that they aren’t just entertaining, but actually help you use Tableau more productively in the future.
#9: Top 15 Tableau LOD Expressions
Level of Detail Expressions (LOD’s) are a great way of gaining insights in your data.
They allow you to find underlying detail outliers in views that require aggregated data. They allow you to compare data in a visualisation to data that is NOT in the visualisation. They enable you to produce “end of period” values rather than summing or averaging – essential when, for example, you have daily headcount information in your data, but just want to know the number of employees at the end of a period.
I could go on, but I don’t need to, because Bethany Lyons wrote a fantastic blog post that goes into 15 use cases for using LOD expressions.

She explains each use case, details why you need to use LOD’s and then step by step applies how to build up the rationale of each one. You can also then download the workbook for yourself to either reverse engineer, play with or use as a template for your own data set.
A timeless blog that first came out just after LOD’s were first introduced back in 2015!
I still refer my delegates to this on a regular basis – Read the blog here.
LOD’s only really start to make sense when you start to apply them to your own data.
Take a look at the use cases. Swap the dimension and measure terminology for ones that match your business, and identify 2 or 3 that would add value to yourself.
#10: 8 Tableau Dashboard Container Tricks
Dashboard containers in Tableau used to be a bit #marmite…but first their ease of use improved and then their functionality.
If you want to be delivering dashboards quickly and focus on the insights they deliver, they are an essential part of your tool kit that you want to be using effectively.
In comes this easy to read and apply blog by #sqlbelle Donabel Santos. She has some great content available, much of which could have entered into my top 10, but I picked this one simply because not many other people have written so well on this important subject.

This wont take you long to read, BUT, as you go through it, I suggest you take notes on some ways that you can put the ideas into action on specific dashboards or templates that are work in progress, as well as look to use the tips on your next dashboard build.
Where #1 on her list may seem strange, it can save countless minutes faffing around and hitting the “undo” button.
Whereas #8 provides endless hours of fun as well as a significant improvement to the data product that your end users receive from you.
Did we miss any?
Let us know in the comments below and we will moderate suggestions to make sure this post can be a signpost to some of the best Tableau articles our there.
Get your planner out!
Well there you have it, the top 10 must-read blogs for anyone using Tableau.
Remember to schedule in some time to make sure you retain some learning from these great blogs.
For each one that you decide to try, we suggest that you first follow the steps on the data set suggested by the author. Then apply them to your own data, even if you don’t need that technique right now. This is the best way to both learn how it is working in practice and retain the knowledge into your long term memory.
Then, according to Edgar Dales learning pyramid, tell someone else about it and talk them through it to further cement it into your own tool box. Feel free to share this page with others and tell them what light bulb moments you had.
Over to you. Get better and quicker at delivering insights. Enable other people in your organisation so that they can also improve performance.
Make data actionable.
Help Make Change Happen!


