
“Can you just….put this Excel spreadsheet into Tableau?”
How does your team respond when they get asked this?
The dreaded “Can you just…” the most feared words for anyone awaiting instructions! And for many reasons.
When it comes to designing dashboards…you can bet that this phrase will lead to unclear requirements. And unclear requirements typically results in 1 or 2 things happening:
1) The dashboard not being used anywhere nearly as often as the users implied they would.
2) “Can I export the data to Excel?” being asked way too often…
But the real problem is that you are not enabling your users to make decisions. And that means you are not helping improve the performance of your organisation. Which is what it’s all about, isn’t it?
Don’t let your dashboards be like the annoying relative that asks a question, as if they are interested in your opinion… but then cuts you off in your prime, ignores what you were saying, and gives you their opinion instead.
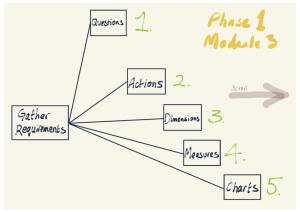
Before designing and analysing, we need to understand what questions we need to answer, and we need to get past the initial questions – taking the “5 Whys” approach – so that we can understand what actions we are wanting to drive. Ultimately, we want to discover the root cause of outcomes that we are investigating.
Only then we will we know what data we need to meet our real objective, and what dimensions and measures we will need to analyse. And then, we can start our analysis, our multiple drill down paths and cross questioning (dashboard actions, tool tips, hierarchy drill downs etc etc) and understanding what data driven highlighting and formatting makes sense.
Too often we get dragged into the analysis before understanding what path our users want (or need) to take.
Before her team came onto our coaching program, Tableau Training on Tap, Ella said:
“The dashboard was seen as the end goal, rather than why it was asked for in the first place. The fact that it was there to solve a business problem.”
When I asked her why they chose Tableau Training on Tap, she said:
“What we realised we wanted, was analysts that understand the business challenges, the requirements, how they have to get the most appropriate way [to present the information] considering the user experience and making sure it’s actually solving the problem that we were asked for in the first place.”
(As a Tableau Ambassador and co-leader of a Tableau User Group, Ella knows what she’s doing.)
According to iSixSigma, the 5 Whys technique was first developed by the Toyota Motor Corporation and was a critical part of its problem-solving approach.
It helps identify the root cause of problems, as well as determining the relationship between them. It’s a simple “tool” that can be used quickly and effectively. As a technique it is typically applied when problems involve human factors or interactions. (Otherwise known as “dashboard users” 😉)
At the end of the first phase in our programme, Design, in Module 3 we go through “Gather Requirements”. This is prior to our delegates analysing their own data and designing dashboards that meet their stakeholders requirements.
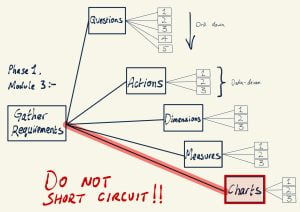
When rolling out Tableau…don’t just focus on the “how-to”. Enlighten on the “what” and the “why”. Don’t short circuit straight through to building charts and putting them on a dashboard.
And don’t forget to solve the problem that you are being asked to solve in the first place…
Make change happen!

Steve Adams
Tableau Coach
PS – Interested in improving Data Literacy in your organisation? Join us online for free, Thursday 2nd Dec at 16:00 on “Improving business performance through Data Literacy”
PPS – Team Leaders, message me to discuss my training and coaching programs or schedule a Discovery Call with me here.
PPPS – You can also see my free training “How your team can deliver action-driving dashboards, quickly and repeatedly with Tableau” anytime here.


