
Still receiving Excel charts in the reports your team send you, when you were expecting a gigantic leap forwards to beautiful, dynamic Tableau stuff?
Or perhaps you are receiving Tableau reports, but they are a little bit 2 dimensional and still with the “default” formatting…?
That’s probably because your team aren’t yet up to speed with the basics of Tableau and either struggle with how long the basics are taking them to get things done.
Or they’ve just thrown in the towel and reverted to what they used to do…
Joseph Heller first introduced us to the concept and term in his classic book, Catch-22, but it has probably not been more concisely parodied than by Michael J Fox in The Secret of My Success:
“How can I get any experience until I get a job that gives me experience?”
The problem tends to be that the majority of Tableau users don’t live and breathe Tableau the moment they walk out of the 2 day training course, or complete their e-learning class.
And they aren’t given sufficient time or, more importantly, support, to “learn on the job”.
This issue is not new, and certainly not specific to Tableau. In the video short we see the Edgar Dale learning pyramid. After 2 weeks we tend to remember only 10% of what we read, but up to 90% of what we say and do.
Make sure that your colleagues have plenty of opportunity to “say and do” while they learn, in the context of your own data… and on real-life challenges.
Another symptom is how long it takes people to finish their Tableau dashboards.
If there’s one take away for you in this weeks newsletter it’s this:
It’s not their fault. It’s yours.
People need to have enough time and support to talk about and “do” things they are learning.
We refer to it as “doing the reps”.
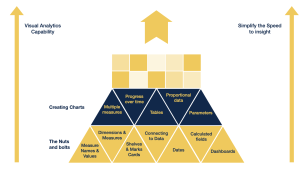
For example, in module 2 of our coaching program we take our delegates through the “nuts and bolts” of how Tableau connects to data, constructs charts, encodes visualisations, building basic bar and line charts and how calculated fields work. Then in Module 4, as shown, we apply that learning to how we build all the “usual suspects” of charts that delegates typically can already produce in their legacy tools (often Excel of course).
But we also have over 50 exercises, based on training data. We encourage delegates to do those first and THEN also apply the learning objective to their own data.
It’s their data, often structured differently and with “issues” that need to be overcome. The context of their own data also means they are applying theory into practice more deeply and often come up with better questions as a result. And “doing the reps” means that the “what” and “how” of Tableau is more deeply engrained during this process.
We then provide regular, live coaching to make sure that people overcome the many common obstacles to applying Tableau in the real word, on their own data.
We also provide off-line, email support because different people have different approaches and agenda’s.
All this means people can overcome challenges quickly and they get us pushing them further, asking them questions that get them thinking about how they can apply techniques in different ways. What would have been roadblocks that demotivate and promote U-turns to legacy tools, have become surmountable challenges, that drive learning and accelerate results.
Applying these exercises often means that either their data needs to have structural changes applied to it or calculated fields added in order to apply a certain chart type or analysis. You know – the sort of stuff you face in the real world.
When I asked Sharon, who recently went through our program, “Can you share any specific results that you achieved whilst on the program?”, she said:
“During the program it was in terms of calculated fields, just how much I could throw at you guys which was very service specific [ie her data] with very little background to the data and you would rise to the challenge and know exactly what I wanted, so we could work together. That worked really well.”
And the beautiful side effect is that people are producing actual charts and analysis on their own data throughout the process, meaning that they really are “learning on the job” and delivery insights during the process.
Remember:
“In theory there is no difference between theory and practice, while in practice there is.”
(Source unknown but often accredited to Albert Einstein, although Benjamin Brewster is believed to have written this first.)
Here is what Will, a Corporate Finance Consultant, said about this approach versus standard training:
“There’s lots of different Tableau courses out there. There’s free ones on YouTube. When I got my Tableau license, I was given one and I bought a whole library of books as well, but nothing could stick.”
Nearing the end of the process we took him through, when asked about the approach on doing the reps he said:
“It’s really good because now there’s certain things which are just natural and you feel confident to try.”
There’s value right there. Set up to continue his learning path.
I have been using our approach as a reference, because it works. I am more than happy for you to copy what we do, build up the content and the support infrastructure and Do It Yourself.
But in case you think working with us in not an option…. you may be asking “how much does it cost to put someone through a 12 week coaching program instead of a quick, intensive 4 days training that can only focus on training data and theory?”
Or maybe you’ve tried the e-learning and the free online tutorials and are still getting charts and dashboards which aren’t driving decisions,
Well, our training programs are getting a feedback average of 9.4 out of 10 and are already more cost effective than the rest…but our coaching program, Tableau Training on Tap is unique….and thats even more cost effective. We have applied the 80:20 rule to time, cost and value.
Please feel free to book a discovery call with me if you’d like to see how we can tailor an approach that meets your needs, within your restricted budget.
If you don’t find a suitable time slot (I know it’s the holidays…) just shoot me a message here on LinkedIn, or comment #TToT below if we are not connected.
Make change happen!

Steve Adams
Tableau Coach, Trainer & Expert Support
VizDJ.com
PS – Want to see if I can help you with training, coaching or support programs? Schedule a Discovery Call with me here.
PPS – You can also see my free training “How your team can deliver action-driving dashboards, quickly and repeatedly with Tableau” anytime here.


