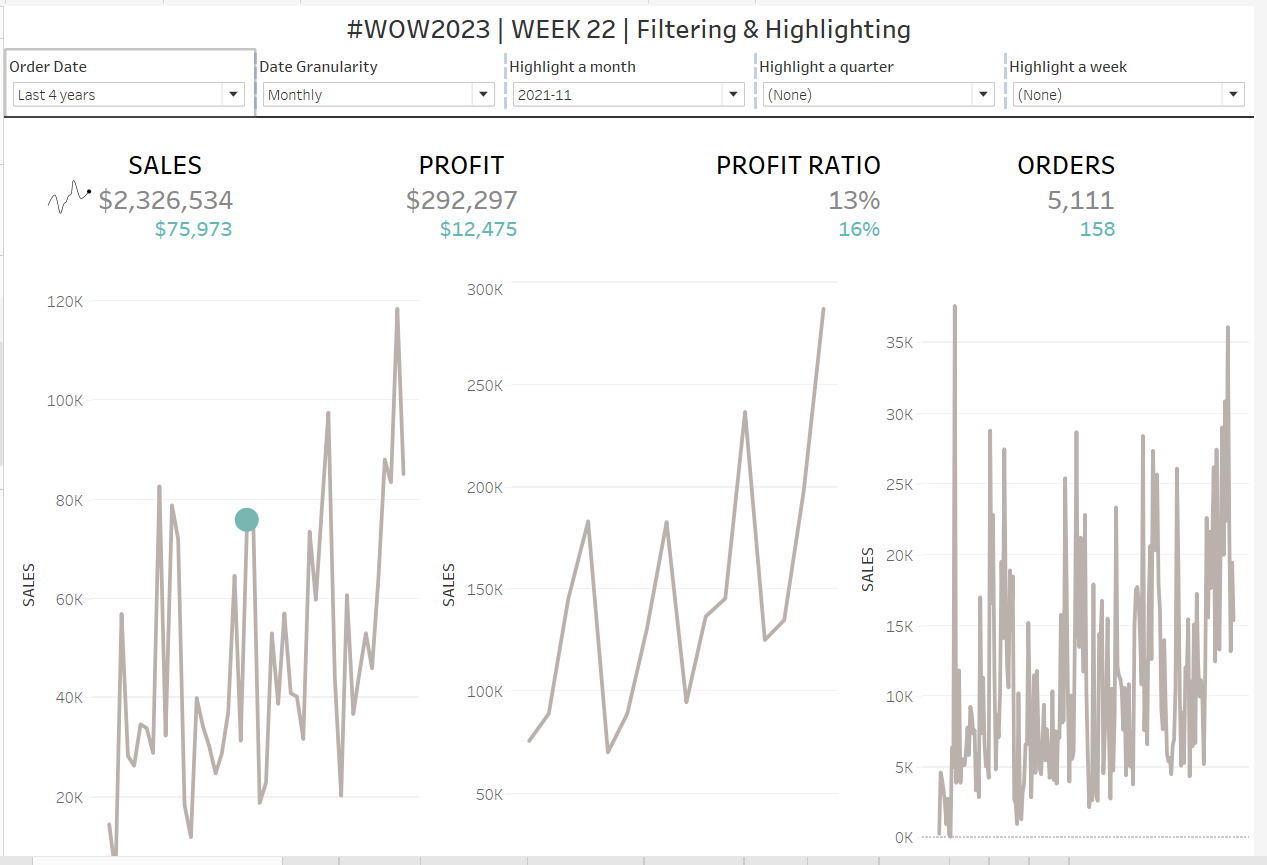
The blog post by Donna Coles delves into the importance of these two aspects in data visualisation. She explains how filtering is a technique used to narrow down a large set of data into smaller, more manageable chunks – especially useful when dealing with vast amounts of data. They can greatly enhance the efficiency and effectiveness of data exploration.
Highlighting, a method used to draw attention to particular pieces of data within a visual representation, helps to distinguish certain data points from the rest, making them stand out for easy identification. This is particularly useful in scenarios where there is a need to emphasise specific information or trends. Its an essential tool for data storytelling. Both filtering and highlighting are powerful tools that can significantly improve the comprehension and interpretability of data visualisations.


