I have been playing around with Polygons a lot more in Tableau lately, and am starting to really like them. Polygons are very valuable, they are often used with Maps, or for sankeys/area charts, but they are also beneficial for emphasizing gaps between two lines.This example shows how to create a Polygon to shade between two lines. This method uses no data prep, and
only 1 calculation. This is an alternative to the Area Chart version, and I think slightly cleaner.To begin, I am going to load up Superstore Dataset. I’m going to look at the spread difference from Running Profit between Furniture and Technology Sales by Month. My goal is to create a shaded area between the two lines.
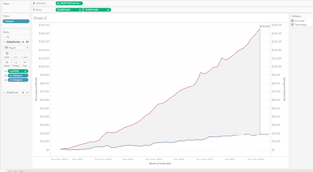

Tableau Training on
Tap Fast Track

Tableau Advanced Analyst

Tableau
Foundation

