That’s where your Tableau Training program comes in.
From beginners to experienced analysts you will want to cover every element of the data journey, and include plenty of hands-on exercises from beginner through to advanced application.
For example, in Module 6 of our 9 module Tableau Training on Tap program, we provide the theory of, amongst others:
✅ Table Calculations
✅ Sets
✅ Trends and forecasts
✅ Reference lines
✅ Maps
✅ Bar-in-bar & bullet charts
✅ Histograms
✅ Box & whisker charts…
…as well as how to create and use Viz in tooltips, parameters and parameter actions.
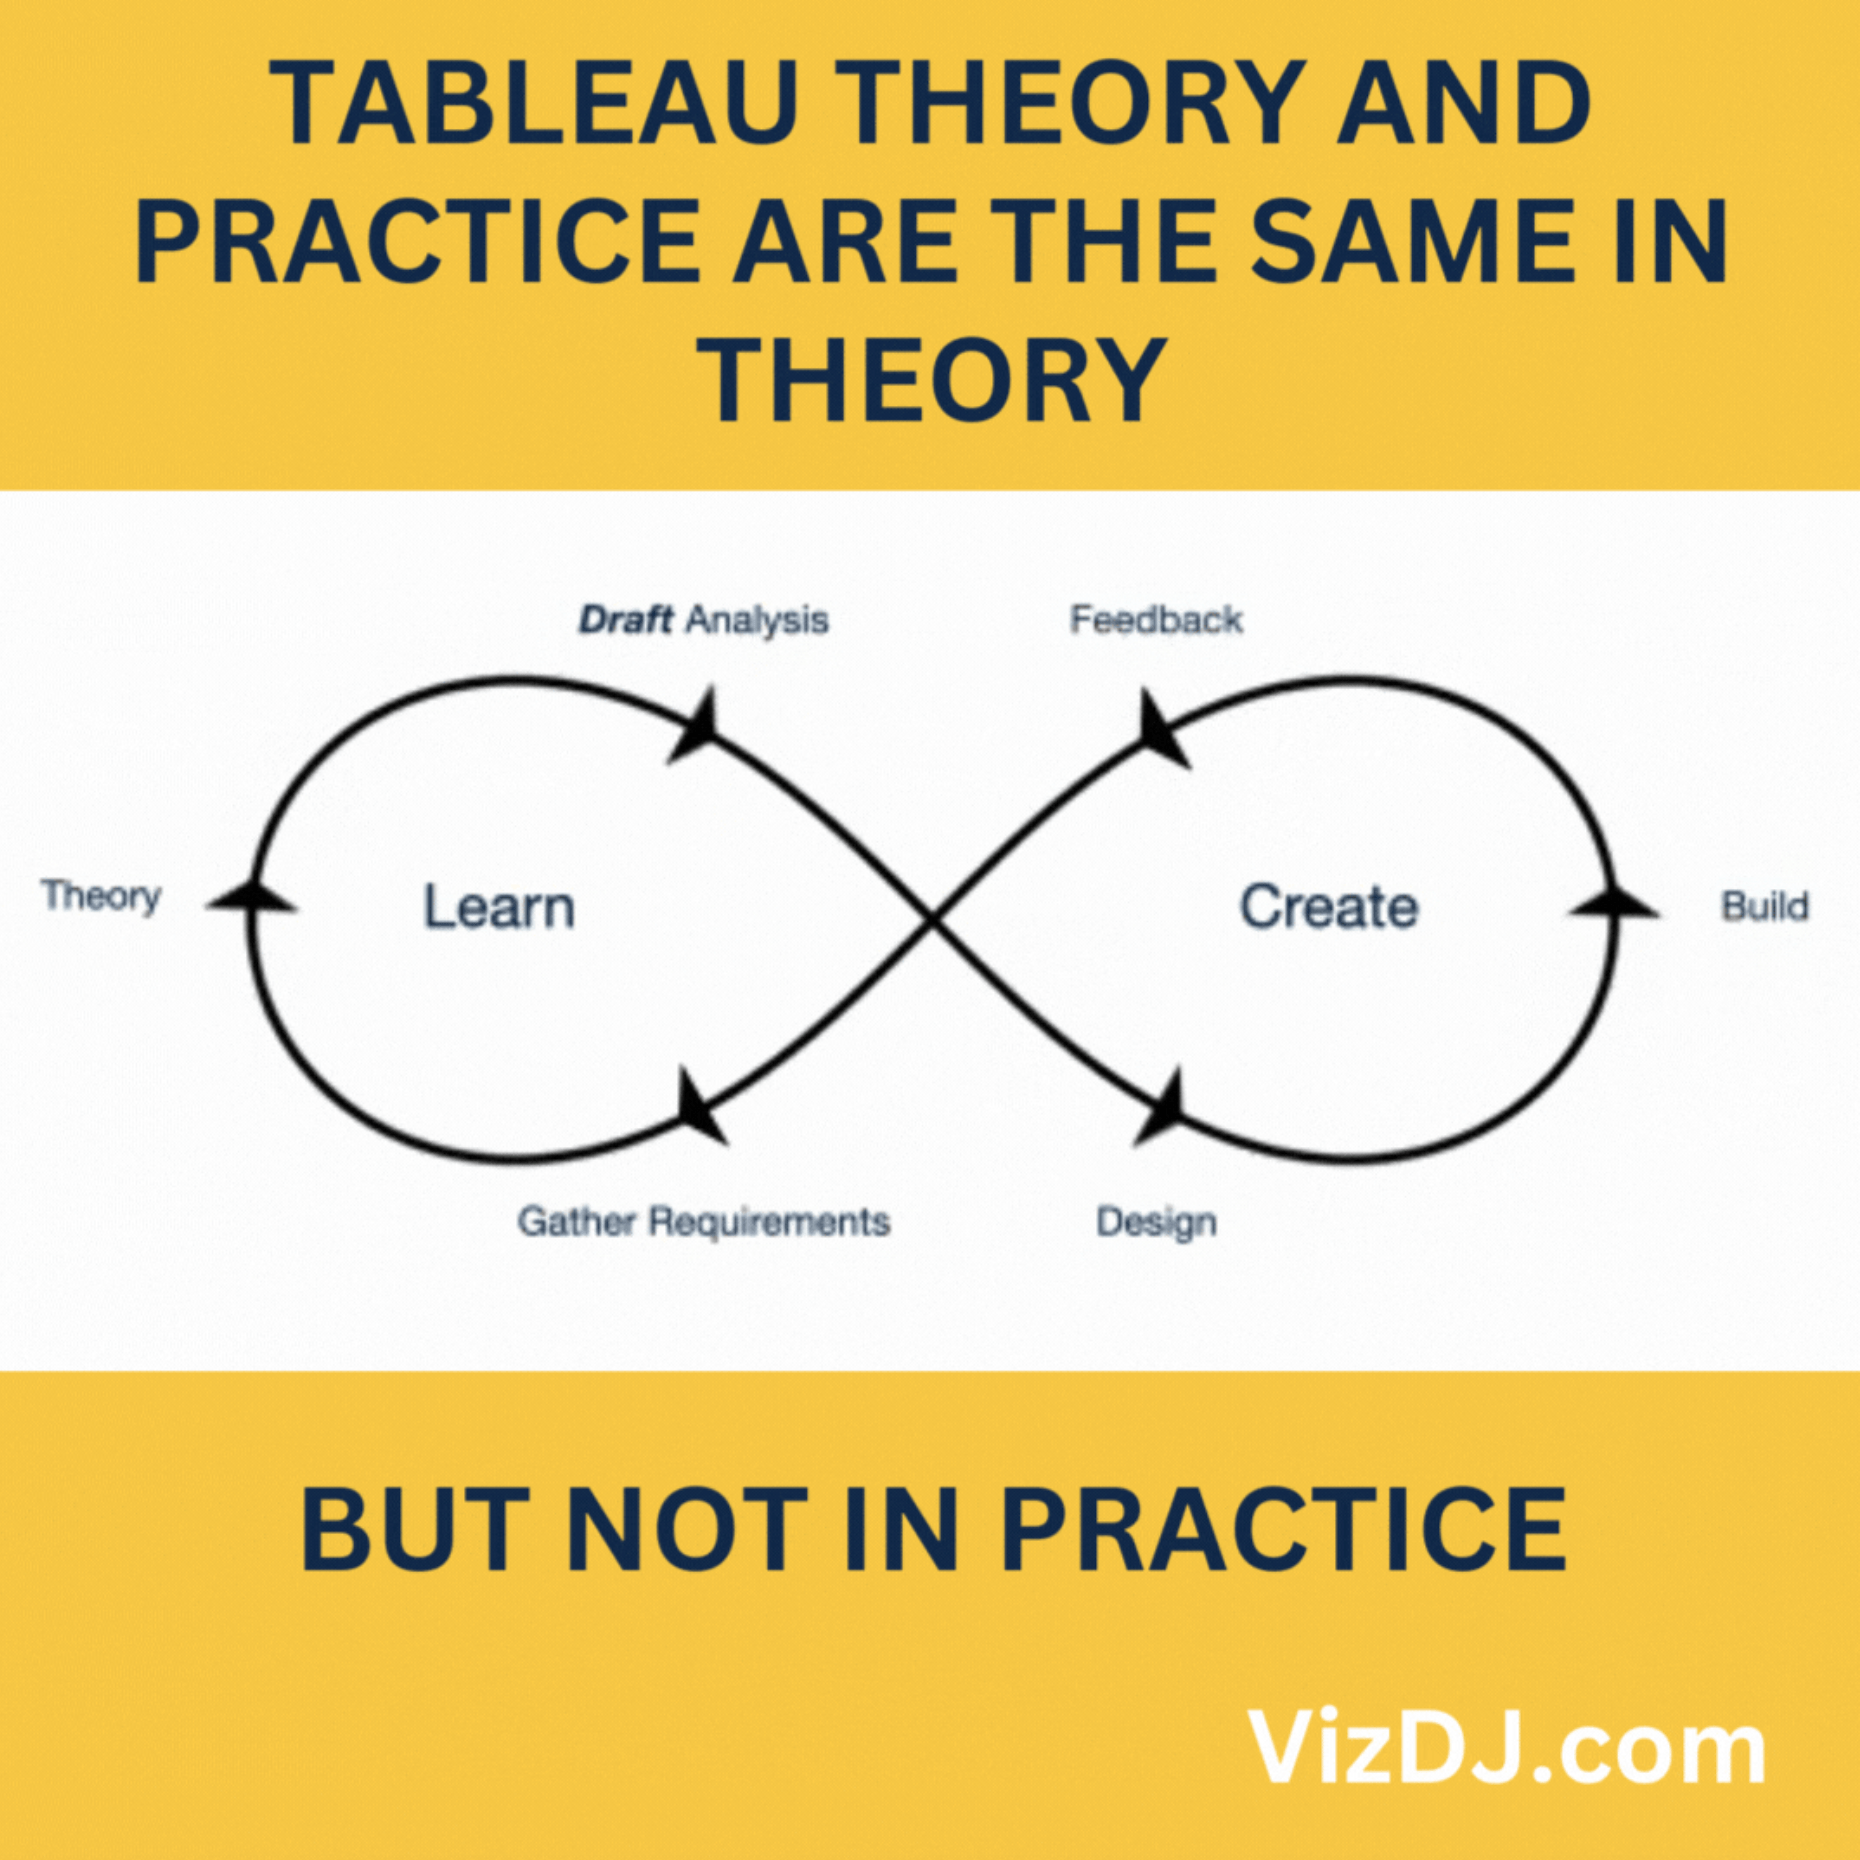
But as the saying goes, theory and practice are the same in theory, but not in practice.
That’s why we encourage you and your delegates to apply each concept to their current work, with the guidance of experienced coaches in live coaching sessions.
By taking an iterative “plan-learn-create” approach, you and your team will develop and evolve their skills and dashboards continuously, well beyond a finite training course.
The result is better and better tools for your team to use regularly, and the confidence to turn good visuals into great insights.
And the motivation to always be learning and improving, in order to squeeze even more value out of the massive wealth you already have in your data.


